Getting Browser Network and Console Logs
To troubleshoot some issues, logs from your browsers' Network and Console tabs will be requested, please see the steps below to pull those logs.
🔧 Accessing Developer Tools
- Press
F12orCtrl+Shift+I(Windows/Linux) - Or
Cmd+Option+I(Mac) - Alternatively: Right-click on the page > Inspect
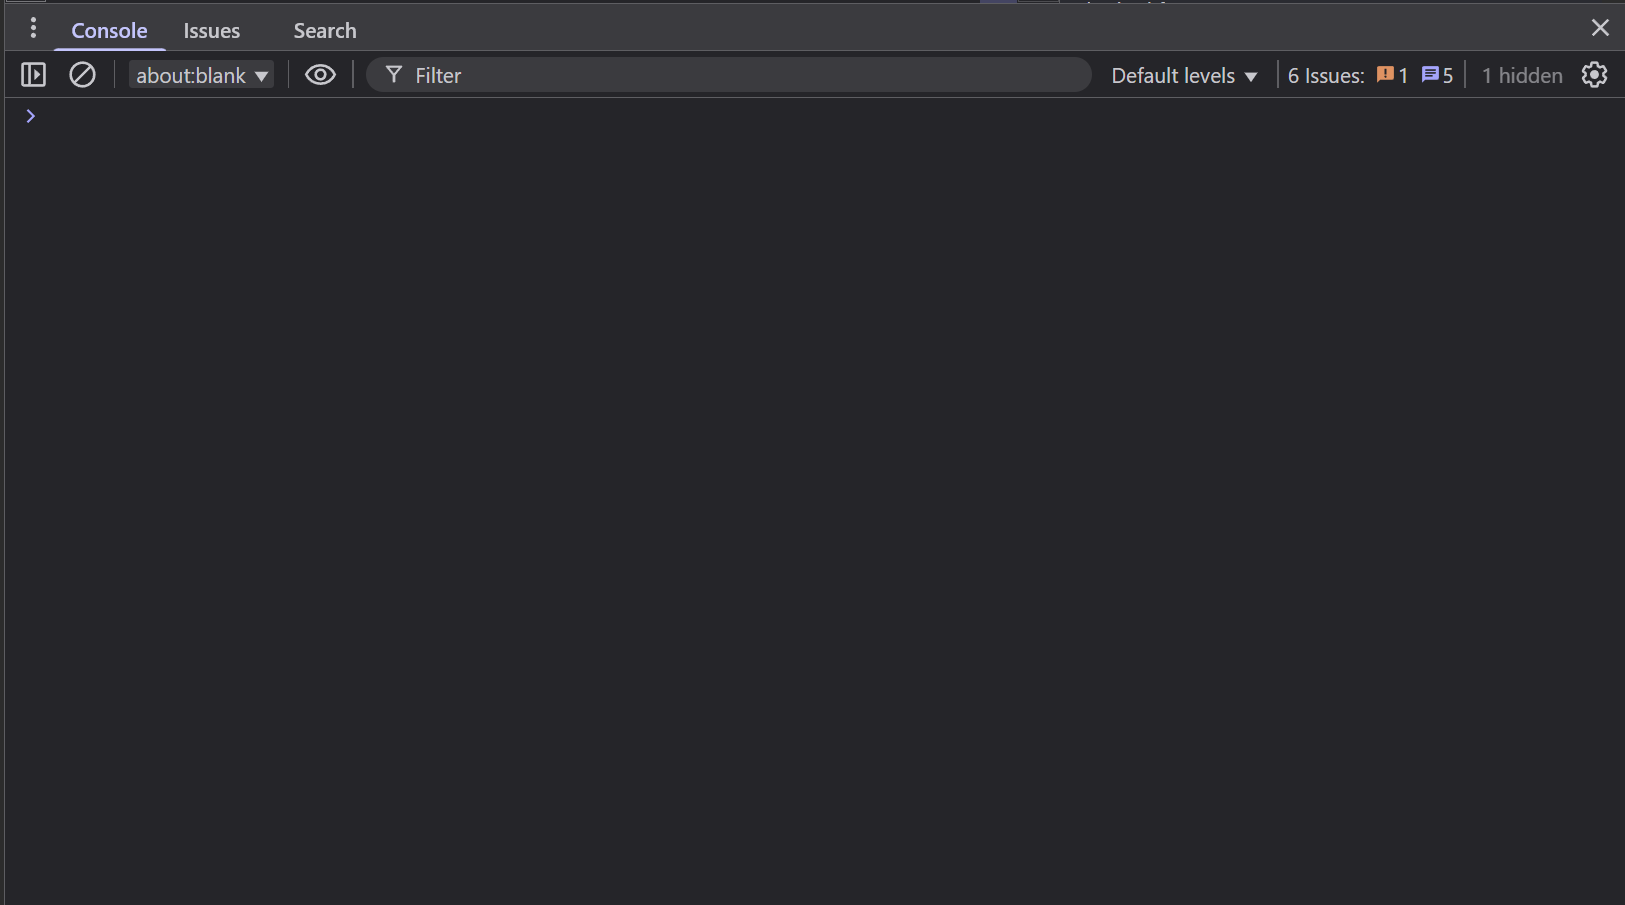
📜 The Console Tab
After opening Developer Tools, click the Console tab.
🌐 Accessing the Network Tab
After opening Developer Tools, click the Network tab.
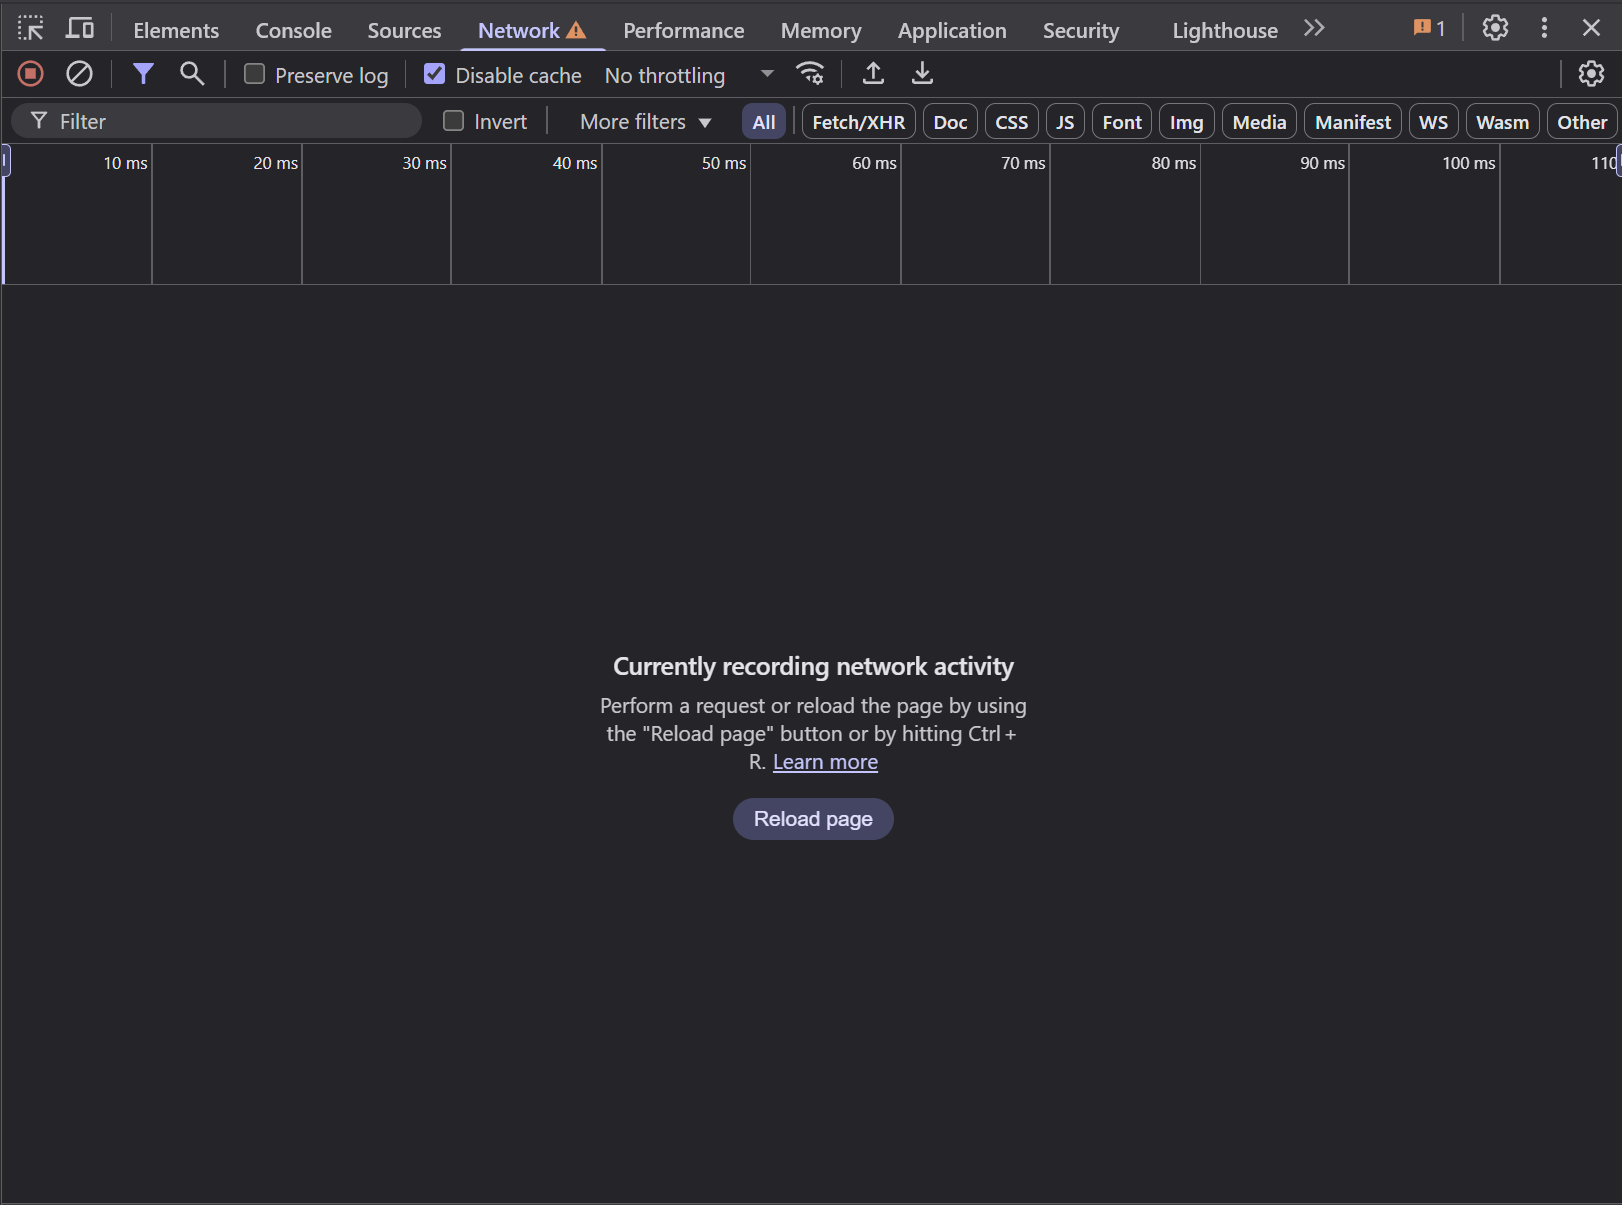
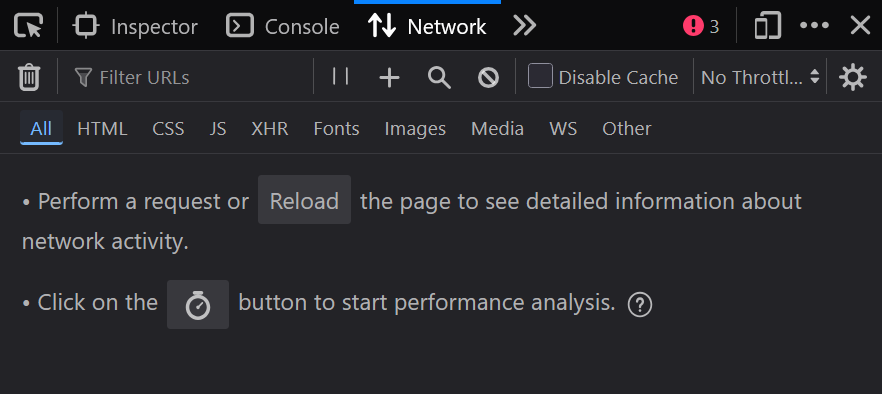
This shows all network requests (like XHR, Fetch, JS, CSS, etc.). Make sure to refresh the page if you opened the tab after the page loaded.
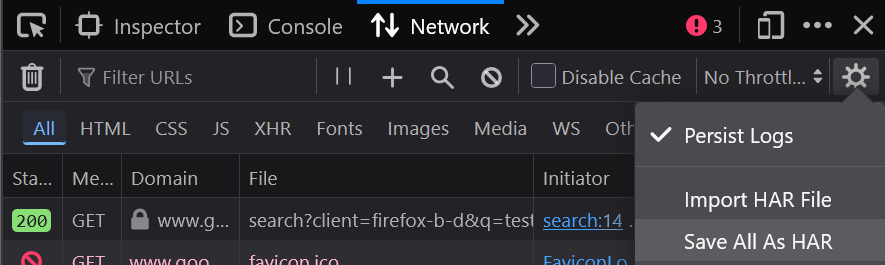
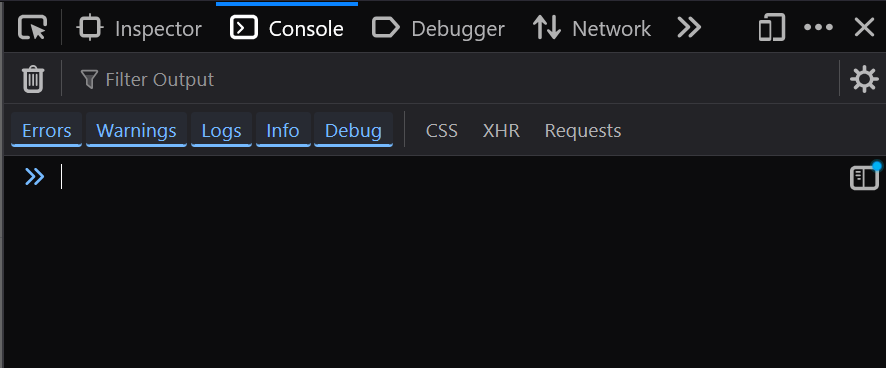
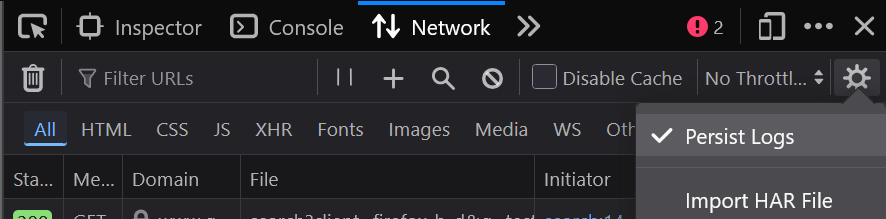
💾 Persisting Logs
By default, logs may clear on navigation or refresh.
To keep logs, on the Network tab look for the "Preserve log" checkbox or the "Persist Logs" dropdown option near the top.

On the Console tab look for the "Preserve Log" checkbox or the "Persist Logs" within the Settings cog near the top.

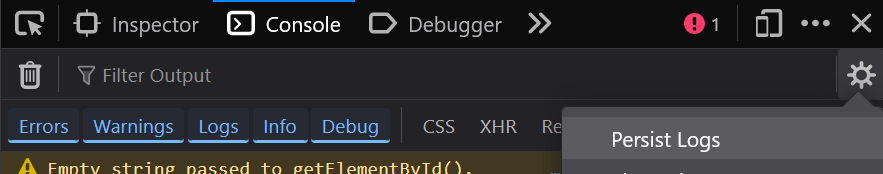
Enable it to keep logs between page loads.
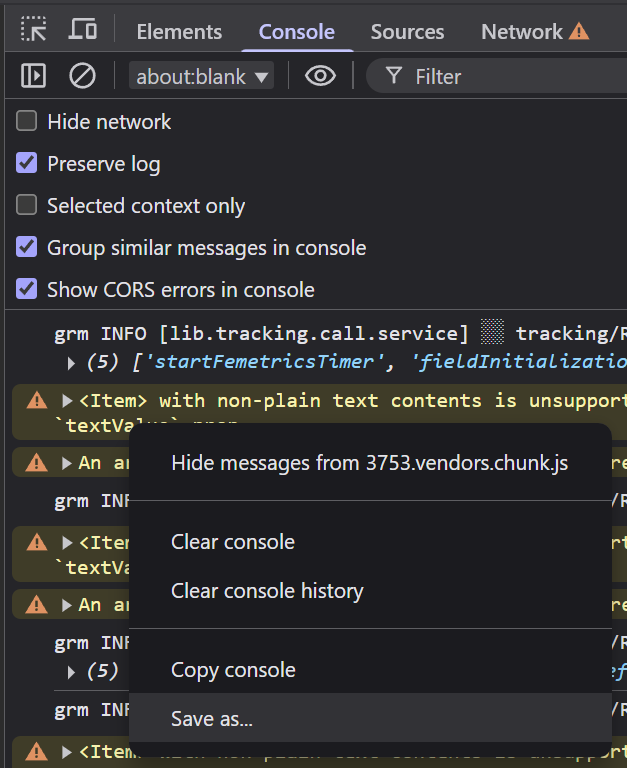
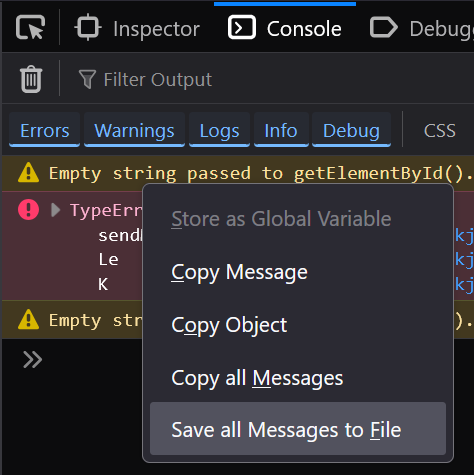
📥 Saving Console Output
- Right-click in the Console area.
- Choose "Save as..." or "Save all Messages to File" to download the console output.
📤 Exporting Network Traffic as HAR
- Go to the Network tab.
- Make sure "Preserve log" is enabled if you want to capture navigation.
- Reload the page or reproduce the issue.
- Click the download button ("Export HAR (sanitized)...") on the top bar.