# Support and Troubleshooting
# Support
What's supported and how to get in touch!
### Getting in touch
Need some help? Simply log in to your [EMS Control Panel](https://ems.element.io/user/hosting#/hosts) with the EMS Account associated with your Element Server Suite Enterprise subscription.
Then click the `Your Account` button, found at the top right of the page, then `Help & Support`.
[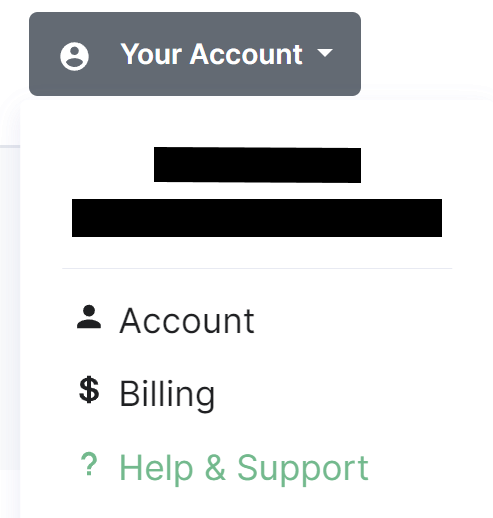](https://ems-docs.element.io/uploads/images/gallery/2024-08/image-1724335816124.png)
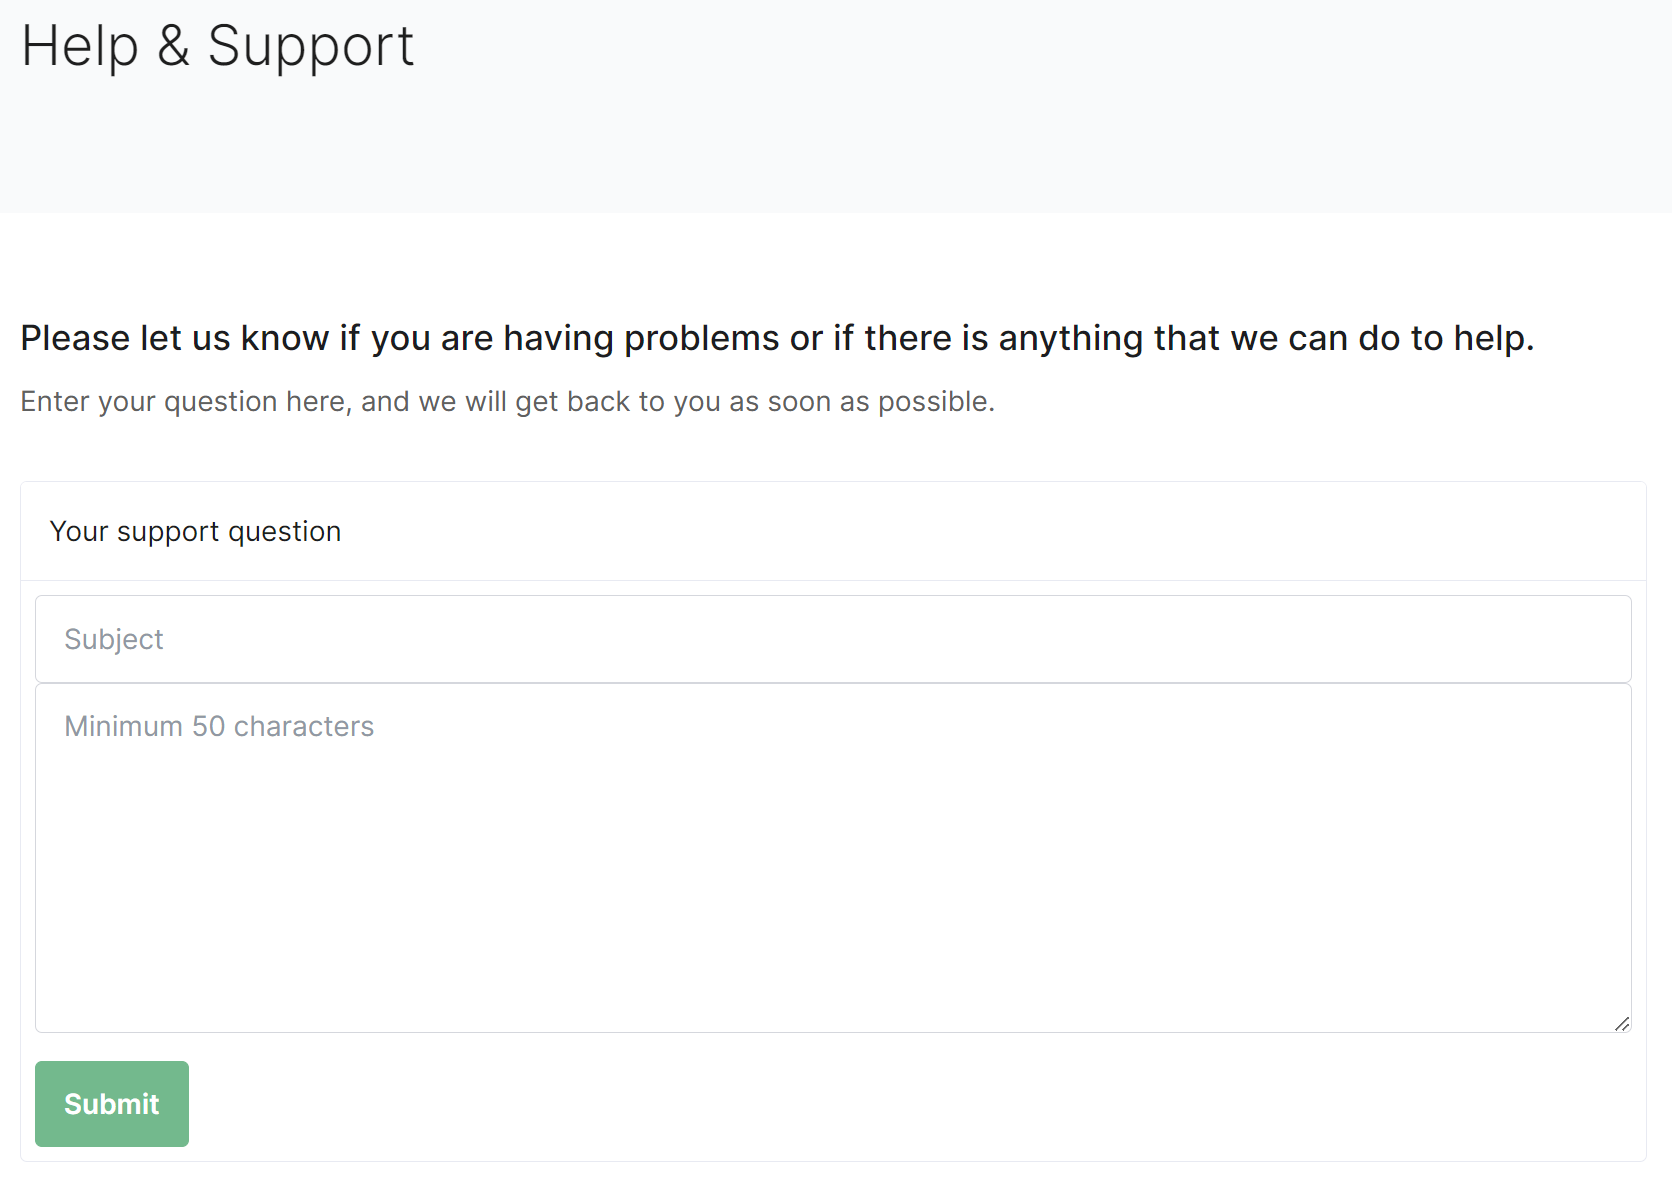
You'll be presented with a contact form:
[](https://ems-docs.element.io/uploads/images/gallery/2024-08/image-1724335840505.png)
Please provide as many details as you can, once submitted, you should receive a confirmation email which you can reply to with any additional information.
### Service Level Agreements (SLA)
This document summarises the SLAs for our price plans and establishes a baseline for our services. For information on our price plans visit:
#### SLA response times
All price plans include unlimited support requests, and all requests are initiated by email or web form.
|
Enterprise |
Sovereign |
| Level 1 Urgent |
4 hours |
2 hours |
| Level 2 High |
8 hours |
4 hours |
| Level 3 Medium |
1 day |
1 day |
| Level 4 Low |
2 days |
2 days |
Business Enterprise Sovereign
Level 1 (Urgent) 1 day 4 hours 2 hours
Level 2 (High) 1 day 8 hours 4 hours
Level 3 (Medium) 2 days 1 day 1 day
Level 4 (Low) 3 days 2 days 2 days
**Coverage:** 9am - 6pm `GMT` / `BST` (`UTC` / `UTC+1`) excluding weekends and UK public holidays
#### Scope of support
##### Includes
- Configuring and operating the Installer including debugging issues
- Synapse Usage/Configuration/Prioritised Bug Fixes
- Element Web Usage/Configuration/Prioritised Bug Fixes
- MicroK8s (when deployed using our installation process)
- Delegated Auth (e.g. SAML/LDAP)
- Group Sync (LDAP, AD Graph API, SCIM supported)
- Integration with GitHub/GitLab/VoIP/webhooks/Jira/Bridges to TG, WA and IRC
- Adminbot and Auditbot
##### Excludes
- Infrastructure assistance
- Multi-node/Full Kubernetes management
- Operating System support
- PostgreSQL database support (when not installed by our installer in a standalone)
- MicroK8s deployment
- Troubleshooting Jitsi
##### Important information
- Pre-existing Kubernetes environments must deploy a self-managed PostgreSQL separately
- Components and integrations (e.g. Group Sync) must be installed via our provided methods
- Backup and underlying storage services are to be provided by the customer
# Troubleshooting
# Introduction to Troubleshooting
Troubleshooting the Element Installer comes down to knowing a little bit about kubernetes and how to check the status of the various resources. This guide will walk you through some of the initial steps that you'll want to take when things are going wrong.
## Known issues
### Installer fails and asks you to start firewalld
The current installer will check if you have firewalld installed on your system. It does expect to find firewalld started as a systemd service if it is installed. If it is not started, the installer will terminate with a failure that asks you to start it. We noticed some Linux distributions like SLES15P4, RHEL8 and AlmaLinux8 that have firewalld installed as a default package but not enabled, or started.
If you hit this issue, you don't need to enable and start firewalld. The workaround is to uninstall firewalld, if you are not planning on using it.
On SLES
```bash
zypper remove firewalld -y
```
On RHEL8
```bash
dnf remove firewalld -y
```
### Airgapped installation does not start
If you are using element-enterprise-graphical-installer-2023-03.02-gui.bin and element-enterprise-installer-airgapped-2023-03.02-gui.tar.gz. You might run into an error looking like this:
```plaintext
Looking in links: ./airgapped/pip
WARNING: Url './airgapped/pip' is ignored. It is either a non-existing path or lacks a specific scheme.
ERROR: Could not find a version that satisfies the requirement wheel (from versions: none)
ERROR: No matching distribution found for wheel
```
The workaround for it is to copy the pip folder from the airgapped directory to ~/.element-enterprise-server/installer/airgapped/pip
### Wiping all user data and start fresh with an existing config
On a standalone deployment you can wipe and start fresh by running:
`sudo snap remove microk8s --purge && sudo rm -rf /data && sudo reboot`
then run `./.bin unattended` (this will require passwordless sudo to run noninteractively)
### Failure downloading https://..., An unknown error occurred: ''CustomHTTPSConnection'' object has no attribute ''cert_file''
Make sure you are using a supported operating system version. See for more details.
## install.sh problems
Sometimes there will be problems when running the ansible-playbook portion of the installer. When this happens, you can increase the verbosity of ansible logging by editing `.ansible.rc` in the installer directory and setting:
```bash
export ANSIBLE_DEBUG=true
export ANSIBLE_VERBOSITY=4
```
and re-running the installer. This will generate quite verbose output, but that typically will help pinpoint what the actual problem with the installer is.
## Problems post-installation
### Checking Pod Status and Getting Logs
- In general, a well-functioning Element stack has at it's minimum the following containers (or pods in kubernetes language) running:
```bash
[user@element2 ~]$ kubectl get pods -n element-onprem
kubectl get pods -n element-onprem
NAME READY STATUS RESTARTS AGE
first-element-deployment-element-web-6cc66f48c5-lvd7w 1/1 Running 0 4d20h
first-element-deployment-element-call-c9975d55b-dzjw2 1/1 Running 0 4d20h
integrator-postgres-0 3/3 Running 0 4d20h
synapse-postgres-0 3/3 Running 0 4d20h
first-element-deployment-integrator-59bcfc67c5-jkbm6 3/3 Running 0 4d20h
adminbot-admin-app-element-web-c9d456769-rpk9l 1/1 Running 0 4d20h
auditbot-admin-app-element-web-5859f54b4f-8lbng 1/1 Running 0 4d20h
first-element-deployment-synapse-redis-68f7bfbdc-wht9m 1/1 Running 0 4d20h
first-element-deployment-synapse-haproxy-7f66f5fdf5-8sfkf 1/1 Running 0 4d20h
adminbot-pipe-0 1/1 Running 0 4d20h
auditbot-pipe-0 1/1 Running 0 4d20h
first-element-deployment-synapse-admin-ui-564bb5bb9f-87zb4 1/1 Running 0 4d20h
first-element-deployment-groupsync-0 1/1 Running 0 20h
first-element-deployment-well-known-64d4cfd45f-l9kkr 1/1 Running 0 20h
first-element-deployment-synapse-main-0 1/1 Running 0 20h
first-element-deployment-synapse-appservice-0 1/1 Running 0 20h
```
The above `kubectl get pods -n element-onprem` is the first place to start. You'll notice in the above, all of the pods are in the `Running` status and this indicates that all should be well. If the state is anything other than "Running" or "Creating", then you'll want to grab logs for those pods. To grab the logs for a pod, run:
```bash
kubectl logs -n element-onprem
```
replacing `` with the actual pod name. If we wanted to get the logs from synapse, the specific syntax would be:
```bash
kubectl logs -n element-onprem first-element-deployment-synapse-main-0
```
and this would generate logs similar to:
```bash
2022-05-03 17:46:33,333 - synapse.util.caches.lrucache - 154 - INFO - LruCache._expire_old_entries-2887 - Dropped 0 items from caches
2022-05-03 17:46:33,375 - synapse.storage.databases.main.metrics - 471 - INFO - generate_user_daily_visits-289 - Calling _generate_user_daily_visits
2022-05-03 17:46:58,424 - synapse.metrics._gc - 118 - INFO - sentinel - Collecting gc 1
2022-05-03 17:47:03,334 - synapse.util.caches.lrucache - 154 - INFO - LruCache._expire_old_entries-2888 - Dropped 0 items from caches
2022-05-03 17:47:33,333 - synapse.util.caches.lrucache - 154 - INFO - LruCache._expire_old_entries-2889 - Dropped 0 items from caches
2022-05-03 17:48:03,333 - synapse.util.caches.lrucache - 154 - INFO - LruCache._expire_old_entries-2890 - Dropped 0 items from caches
```
- Again, for every pod not in the `Running` or `Creating` status, you'll want to use the above procedure to get the logs for Element to look at.
- If you don't have any pods in the `element-onprem` namespace as indicated by running the above command, then you should run:
```bash
[user@element2 ~]$ kubectl get pods -A
NAMESPACE NAME READY STATUS RESTARTS AGE
kube-system calico-node-2lznr 1/1 Running 0 8d
kube-system calico-kube-controllers-c548999db-s5cjm 1/1 Running 0 8d
kube-system coredns-5dbccd956f-glc8f 1/1 Running 0 8d
kube-system dashboard-metrics-scraper-6b6f796c8d-8x6p4 1/1 Running 0 8d
ingress nginx-ingress-microk8s-controller-w8lcn 1/1 Running 0 8d
cert-manager cert-manager-cainjector-6586bddc69-9xwkj 1/1 Running 0 8d
kube-system hostpath-provisioner-78cb89d65b-djfq5 1/1 Running 0 8d
kube-system kubernetes-dashboard-765646474b-5lhxp 1/1 Running 0 8d
cert-manager cert-manager-5bb9dd7d5d-cg9h8 1/1 Running 0 8d
container-registry registry-f69889b8c-zkhm5 1/1 Running 0 8d
cert-manager cert-manager-webhook-6fc8f4666b-9tmjb 1/1 Running 0 8d
kube-system metrics-server-5f8f64cb86-f876p 1/1 Running 0 8d
jitsi sysctl-jvb-vs9mn 1/1 Running 0 8d
jitsi shard-0-jicofo-7c5cd9fff5-qrzmk 1/1 Running 0 8d
jitsi shard-0-web-fdd565cd6-v49ps 1/1 Running 0 8d
jitsi shard-0-web-fdd565cd6-wmzpb 1/1 Running 0 8d
jitsi shard-0-prosody-6d466f5bcb-5qsbb 1/1 Running 0 8d
jitsi shard-0-jvb-0 1/2 Running 0 8d
operator-onprem element-operator-controller-manager-... 2/2 Running 0 4d
updater-onprem element-updater-controller-manager-... 2/2 Running 0 4d
element-onprem first-element-deployment-element-web-... 1/1 Running 0 4d
element-onprem first-element-deployment-element-call-... 1/1 Running 0 4d
element-onprem integrator-postgres-0 3/3 Running 0 4d
element-onprem synapse-postgres-0 3/3 Running 0 4d
element-onprem first-element-deployment-integrator-... 3/3 Running 0 4d
element-onprem adminbot-admin-app-element-web-... 1/1 Running 0 4d
element-onprem auditbot-admin-app-element-web-... 1/1 Running 0 4d
element-onprem first-element-deployment-synapse-redis-... 1/1 Running 0 4d
element-onprem first-element-deployment-synapse-haproxy-.. 1/1 Running 0 4d
element-onprem adminbot-pipe-0 1/1 Running 0 4d
element-onprem auditbot-pipe-0 1/1 Running 0 4d
element-onprem first-element-deployment-synapse-admin-ui-. 1/1 Running 0 4d
element-onprem first-element-deployment-groupsync-0 1/1 Running 0 20h
element-onprem first-element-deployment-well-known-... 1/1 Running 0 20h
element-onprem first-element-deployment-synapse-main-0 1/1 Running 0 20h
element-onprem first-element-deployment-synapse-appservice-0 1/1 Running 0 20h
```
- This is the output from a healthy system, but if you have any of these pods not in the `Running` or `Creating` state, then please gather logs using the following syntax:
```bash
kubectl logs -n
```
- So to gather logs for the kubernetes ingress, you would run:
```bash
kubectl logs -n ingress nginx-ingress-microk8s-controller-w8lcn
```
and you would see logs similar to:
```bash
I0502 14:15:08.467258 6 leaderelection.go:248] attempting to acquire leader lease ingress/ingress-controller-leader...
I0502 14:15:08.467587 6 controller.go:155] "Configuration changes detected, backend reload required"
I0502 14:15:08.481539 6 leaderelection.go:258] successfully acquired lease ingress/ingress-controller-leader
I0502 14:15:08.481656 6 status.go:84] "New leader elected" identity="nginx-ingress-microk8s-controller-n6wmk"
I0502 14:15:08.515623 6 controller.go:172] "Backend successfully reloaded"
I0502 14:15:08.515681 6 controller.go:183] "Initial sync, sleeping for 1 second"
I0502 14:15:08.515705 6 event.go:282] Event(v1.ObjectReference{Kind:"Pod", Namespace:"ingress", Name:"nginx-ingress-microk8s-controller-n6wmk", UID:"548d9478-094e-4a19-ba61-284b60152b85", APIVersion:"v1", ResourceVersion:"524688", FieldPath:""}): type: 'Normal' reason: 'RELOAD' NGINX reload triggered due to a change in configuration
```
Again, for all pods not in the `Running` or `Creating` state, please use the above method to get log data to send to Element.
### Default administrator
The installer creates a default administrator `onprem-admin-donotdelete`
The Synapse admin user password is defined under the synapse section in the installer
### Error: UPGRADE FAILED: another operation (install/upgrade/rollback) is in progress
Delete the updater namespace and Deploy again.
```bash
kubectl delete namespaces updater-onprem
```
### microk8s takes a logn time to become ready after system boot
See
### Node-based pods failing name resolution
```log
05:03:45:601 ERROR [Pipeline] Unable to verify identity configuration for bot-auditbot: Unknown errcode Unknown error
05:03:45:601 ERROR [Pipeline] Unable to verify identity. Stopping
matrix-pipe encountered an error and has stopped Error: getaddrinfo EAI_AGAIN synapse.prod.ourdomain
at GetAddrInfoReqWrap.onlookup [as oncomplete] (node:dns:84:26) {
errno: -3001,
code: 'EAI_AGAIN',
syscall: 'getaddrinfo',
hostname: 'synapse.prod.ourdomain'
}
```
To see what Hosts are set, try:
```bash
kubectl exec -it -n element-onprem getent hosts
```
So to do this on the adminbot-pipe-0 pod, it would look like:
```bash
kubectl exec -it -n element-onprem adminbot-pipe-0 getent hosts
```
and return output similar to:
```bash
127.0.0.1 localhost
127.0.0.1 localhost ip6-localhost ip6-loopback
10.1.241.27 adminbot-pipe-0
192.168.122.5 ems.onprem element.ems.onprem hs.ems.onprem adminbot.ems.onprem auditbot.ems.onprem integrator.ems.onprem hookshot.ems.onprem admin.ems.onprem eleweb.ems.onprem
```
### Node-based pods failing SSL
```bash
2023-02-06 15:42:04 ERROR: IrcBridge Failed to fetch roomlist from joined rooms: Error: unable to verify the first certificate. Retrying
MatrixHttpClient (REQ-13) Error: unable to verify the first certificate
at TLSSocket.onConnectSecure (_tls_wrap.js:1515:34)
at TLSSocket.emit (events.js:400:28)
at TLSSocket.emit (domain.js:475:12)
at TLSSocket. finishInit (_tls_wrap.js:937:8),
at TLSWrap.ssl.onhandshakedone (_tls_wrap.js:709:12) {
code: 'UNABLE TO VERIFY LEAF SIGNATURE
```
Drop into a shell on the pod
```bash
kubectl exec -it -n element-onprem adminbot-pipe-0 -- /bin/sh
```
Check it's ability to send a request to the Synapse server
```plaintext
node
require=("http")
request(https://synapse.server/)
```
### Postgres Corrupted `pg_statistic`
Get the Postgres image used:
```bash
kubectl get pod synapse-postgres-0 -n element-onprem -o jsonpath='{.spec.containers[0].image}'
```
Scale down the Postgres container:
```bash
kubectl scale statefulset synapse-postgres --replicas=0 -n element-onprem
```
Create the recovery pod (replacing with the Postgres image retrieved above):
```bash
kubectl run pg-recovery --rm -it --restart=Never \
--image=docker.io/library/postgres@sha256:13ae5ab08d8400b3002da7495978381b83ad094c24f54d7cd7ddebefc5ac9e64 \
--namespace=element-onprem \
--overrides='{
"spec": {
"securityContext": {
"runAsUser": 999,
"runAsGroup": 999,
"fsGroup": 999
},
"containers": [{
"name": "pg-recovery",
"image": "docker.io/library/postgres@sha256:13ae5ab08d8400b3002da7495978381b83ad094c24f54d7cd7ddebefc5ac9e64",
"securityContext": {
"runAsUser": 999,
"runAsGroup": 999,
"allowPrivilegeEscalation": false
},
"command": ["postgres", "--single", "-D", "/var/lib/postgresql/data", "synapse"],
"stdin": true,
"tty": true,
"volumeMounts": [{
"name": "database",
"mountPath": "/var/lib/postgresql/data"
}]
}],
"volumes": [{
"name": "database",
"persistentVolumeClaim": {
"claimName": "synapse-postgres"
}
}]
}
}'
```
Once inside the recovery pod, run these individually, then CTRL-D to exit:
```sql
DELETE FROM pg_statistic;
ANALYZE;
VACUUM FULL pg_statistic;
```
The `ANALYZE` step ran continuously so I cancelled, leaving for completeness.
Scale back up the Postgres container:
```bash
kubectl scale statefulset synapse-postgres --replicas=1 -n element-onprem
```
Delete Synapse / any other stuck pods / those not working due to this issue (Sliding Sync Proxy, Admin/Audit Bot, Hookshot etc.)
### Reconciliation failing / Enable enhanced updater logging
If your reconciliation is failing, a good place to start is with the updater logs
```bash
kubectl --namespace updater-onprem logs \
"$(kubectl --namespace updater-onprem get pods --no-headers \
--output=custom-columns="NAME:.metadata.name" | grep controller)" \
--since 10m
```
If that doesn't have the answers you seek, for example
```plaintext
TASK [Build all components manifests] ********************************
fatal: [localhost]: FAILED! => {"censored": "the output has been hidden due to
the fact that 'no_log: true' was specified for this result"}
```
You can enable debug logging by editing the updater deployment
```bash
kubectl --namespace updater-onprem edit \
deploy/element-updater-controller-manager
```
In this file, search for `env` and add the this variable to all occurrences
```yaml
- name: DEBUG_MANIFESTS
value: "1"
```
Wait a bit for the updater to re-run and then fetch the updater logs again. Look for `fatal` or to get the stdout from Ansible, look for `Ansible Task StdOut`. See also [Unhealthy deployment](#bkmrk-unhealthy-deployment) below.
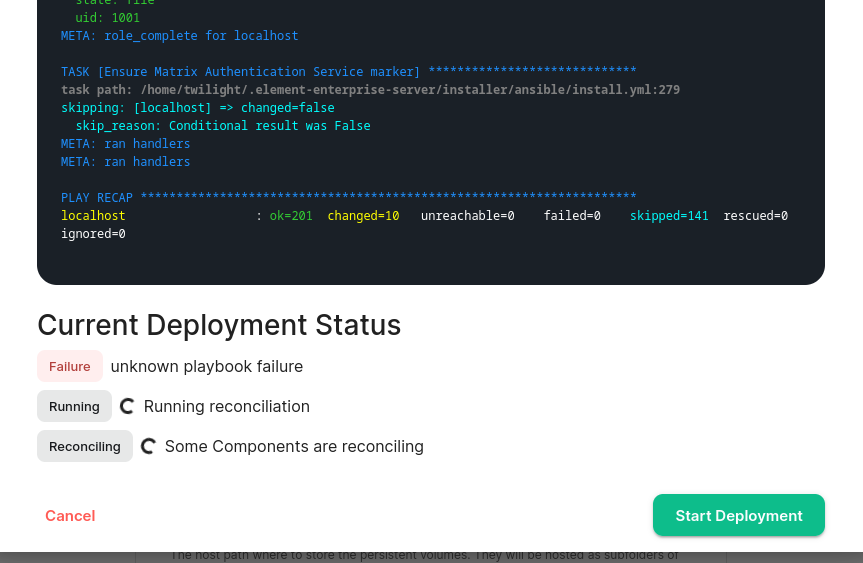
Click for a specific example
I had this "unknown playbook failure"
[](https://ems-docs.element.io/uploads/images/gallery/2024-07/image-1720802779508.png)
After enabling debug logging for the updater, I found this error telling me that my Telegram bridge is misconfigured
```plaintext
--------------------------- Ansible Task StdOut -------------------------------
TASK [Build all components manifests] ********************************
fatal: [localhost]: FAILED! => {"msg": "The task includes an option with an
undefined variable. The error was: 'dict object' has no attribute
'telegramApiId'. 'dict object' has no attribute 'telegramApiId'. 'dict object'
has no attribute 'telegramApiId'. 'dict object' has no attribute
'telegramApiId'. 'dict object' has no attribute 'telegramApiId'. 'dict object'
has no attribute 'telegramApiId'. 'dict object' has no attribute
'telegramApiId'. 'dict object' has no attribute 'telegramApiId'\n\nThe error
appears to be in '/element.io/roles/elementdeployment/tasks/prepare.yml': line
21, column 3, but may\nbe elsewhere in the file depending on the exact syntax
problem.\n\nThe offending line appears to be:\n\n\n- name: \"Build all
components manifests\"\n ^ here\n"}
```
### Unhealthy deployment
```bash
kubectl get elementdeployment --all-namespaces --output yaml
```
In the status you will see which component is having an issue. You can then do
```bash
kubectl --namespace element-onprem get ``/`` --output yaml
```
And you would see the issue in the status.
### Other Commands of Interest
Some other commands that may yield some interesting data while troubleshooting are:
#### Check list of active kubernetes events
```bash
kubectl get events -A
```
You will see a list of events or the message `No resources found`.
- Show the state of services in the `element-onprem` namespace:
```bash
kubectl get services -n element-onprem
```
This should return output similar to:
```bash
NAME TYPE CLUSTER-IP EXTERNAL-IP PORT(S) AGE
postgres ClusterIP 10.152.183.47 5432/TCP 6d23h
app-element-web ClusterIP 10.152.183.60 80/TCP 6d23h
server-well-known ClusterIP 10.152.183.185 80/TCP 6d23h
instance-synapse-main-headless ClusterIP None 80/TCP 6d23h
instance-synapse-main-0 ClusterIP 10.152.183.105 80/TCP,9093/TCP,9001/TCP 6d23h
instance-synapse-haproxy ClusterIP 10.152.183.78 80/TCP 6d23h
```
#### Connect to the Synapse Database
```bash
kubectl --namespace element-onprem exec --container postgres --stdin --tty synapse-postgres-0 -- bash
psql "dbname=$POSTGRES_DB user=$POSTGRES_USER password=$POSTGRES_PASSWORD"
```
The variables `POSTGRES_DB`, `POSTGRES_USER`, and `POSTGRES_PASSWORD` are already set on the postgres pod, so you do not need to know or find the values. Just paste the `psql` command as it is above and press enter.
#### Excessive Synapse Database Space Usage
Connect to the Synapse database.
**SQL queries provided for reference only. Ensure you fully understand what they do before runnign and use at your own risk.**
##### List tables ordered by size
```sql
SELECT
schemaname AS table_schema,
relname AS table_name,
pg_size_pretty(pg_relation_size(relid)) AS data_size
FROM pg_catalog.pg_statio_user_tables
ORDER BY pg_relation_size(relid) DESC;
```
Example output
```plaintext
table_schema | table_name | data_size
--------------+---------------------------------------+-----------
public | event_json | 2090 MB
public | event_auth | 961 MB
public | events | 399 MB
public | current_state_delta_stream | 341 MB
public | state_groups_state | 294 MB
public | room_memberships | 270 MB
public | cache_invalidation_stream_by_instance | 265 MB
public | stream_ordering_to_exterm | 252 MB
public | state_events | 249 MB
public | event_edges | 208 MB
(10 rows)
```
##### Count unique values in a table ordered by count
This example counts events per room from the `event_json` table (where all your messages etc. are stored). This may take a while to run and may use a lot of system resources.
```sql
SELECT
room_id,
COUNT(*) AS count
FROM event_json
GROUP BY room_id
ORDER BY count DESC
LIMIT 10;
```
Example output
```plaintext
room_id | count
---------------------------------+---------
!GahmaiShiezefienae:example.com | 1382242
!gutheetheixuFohmae:example.com | 1933
!OhnuokaiCoocieghoh:example.com | 357
!efaeMegazeeriteibo:example.com | 175
!ohcahTueyaesiopohc:example.com | 93
!ithaeTaiRaewieThoo:example.com | 43
!PhohkuShuShahhieWa:example.com | 39
!eghaiPhetahHohweku:example.com | 37
!faiLeiZeefirierahn:example.com | 29
!Eehahhaepahzooshah:example.com | 27
(10 rows)
```
In this instance something unusual might be going on in `!GahmaiShiezefienae:example.com` that warrants further investigation.
#### Export logs from all Synapse pods to a file
This will export logs from the last 5 minutes.
```bash
for pod in $(kubectl --namespace element-onprem get pods --no-headers \
--output=custom-columns="NAME:.metadata.name" | grep '\-synapse')
do
echo "$pod" >> synapse.log
kubectl --namespace element-onprem logs "$pod" --since 5m >> synapse.log
done
```
#### Grep all configmaps
```bash
for configmap in $(kubectl --namespace element-onprem get configmaps --no-headers --output=custom-columns="NAME:.metadata.name"); do
kubectl --namespace element-onprem describe configmaps "$configmap" \
| grep --extended-regex '(host|password)'
done
```
#### List Synapse pods, sorted by pod age/creation time
```bash
kubectl --namespace element-onprem get pods --sort-by 'metadata.creationTimestamp' | grep --extended-regex '(NAME|-synapse)'
```
#### Matrix Authentication Service admin
If your server use [Matrix Authentication Service](https://element-hq.github.io/matrix-authentication-service/) (MAS), you might accoationally need to interact with this directly. This can be done either using the [MAS Admin API](https://element-hq.github.io/matrix-authentication-service/topics/admin-api.html) or using [`mas-cli`](https://element-hq.github.io/matrix-authentication-service/reference/cli/index.html).
Here is an one-liner for connectign to `mas-cli`:
```bash
kubectl --namespace element-onprem exec --stdin --tty \
"$(kubectl --namespace element-onprem get pods \
--output=custom-columns='NAME:.metadata.name' \
| grep first-element-deployment-matrix-authentication-service)" \
-- mas-cli help
```
Alternately, to make it easier, you can create an alias:
```bash
alias mas-cli='kubectl --namespace element-onprem exec --stdin --tty \
"$(kubectl --namespace element-onprem get pods \
--output=custom-columns="NAME:.metadata.name" \
| grep first-element-deployment-matrix-authentication-service)" \
-- mas-cli '
```
#### Redeploy the micro8ks setup
It is possible to redeploy microk8s by running the following command as root:
```bash
snap remove microk8s
```
This command does remove all microk8s pods and related microk8s storage volumes. **Once this command has been run, you need to reboot your server** - otherwise you may have networking issues. Add `--purge` flag to remove the data if disk usage is a concern.
After the reboot, you can re-run the installer and have it re-deploy microk8s and Element Enterprise On-Premise for you.
#### Show all persistent volumes and persistent volume claims for the `element-onprem` namespace
```bash
kubectl get pv -n element-onprem
```
This will give you output similar to:
```bash
NAME CAPACITY ACCESS MODES RECLAIM POLICY STATUS CLAIM STORAGECLASS REASON AGE
pvc-fc3459f0-eb62-4afa-94ce-7b8f8105c6d1 20Gi RWX Delete Bound container-registry/registry-claim microk8s-hostpath 8d
integrator-postgres 5Gi RWO Recycle Bound element-onprem/integrator-postgres microk8s-hostpath 8d
synapse-postgres 5Gi RWO Recycle Bound element-onprem/synapse-postgres microk8s-hostpath 8d
hostpath-synapse-media 50Gi RWO Recycle Bound element-onprem/first-element-deployment-synapse-media microk8s-hostpath 8d
adminbot-bot-data 10M RWO Recycle Bound element-onprem/adminbot-bot-data microk8s-hostpath 8d
auditbot-bot-data 10M RWO Recycle Bound element-onprem/auditbot-bot-data microk8s-hostpath 8d
```
#### Show deployments in the `element-onprem` namespace
```bash
kubectl get deploy -n element-onprem
```
This will return output similar to:
```bash
NAME READY UP-TO-DATE AVAILABLE AGE
app-element-web 1/1 1 1 6d23h
server-well-known 1/1 1 1 6d23h
instance-synapse-haproxy 1/1 1 1 6d23h
```
#### Show hostname to IP mappings from within a pod
Run:
```bash
kubectl exec -n element-onprem -- getent hosts
```
and you will see output similar to:
```bash
127.0.0.1 localhost
127.0.0.1 localhost ip6-localhost ip6-loopback
10.1.241.30 instance-hookshot-0.instance-hookshot.element-onprem.svc.cluster.local instance-hookshot-0
192.168.122.5 ems.onprem element.ems.onprem hs.ems.onprem adminbot.ems.onprem auditbot.ems.onprem integrator.ems.onprem hookshot.ems.onprem admin.ems.onprem eleweb.ems.onprem
```
This will help you troubleshoot host resolution.
#### Show the Element Web configuration
```bash
kubectl describe cm -n element-onprem app-element-web
```
and this will return output similar to:
```bash
config.json:
----
{
"default_server_config": {
"m.homeserver": {
"base_url": "https://synapse2.local",
"server_name": "local"
}
},
"dummy_end": "placeholder",
"integrations_jitsi_widget_url": "https://dimension.element2.local/widgets/jitsi",
"integrations_rest_url": "https://dimension.element2.local/api/v1/scalar",
"integrations_ui_url": "https://dimension.element2.local/element",
"integrations_widgets_urls": [
"https://dimension.element2.local/widgets"
]
}
```
#### Show the nginx configuration for Element Web: (If using nginx as your ingress controller in production or using thPoC installer.)
```bash
kubectl describe cm -n element-onprem app-element-web-nginx
```
and this will return output similar to:
```plaintext
server {
listen 8080;
add_header X-Frame-Options SAMEORIGIN;
add_header X-Content-Type-Options nosniff;
add_header X-XSS-Protection "1; mode=block";
add_header Content-Security-Policy "frame-ancestors 'self'";
add_header X-Robots-Tag "noindex, nofollow, noarchive, noimageindex";
location / {
root /usr/share/nginx/html;
index index.html index.htm;
charset utf-8;
}
}
```
#### Show the status of all namespaces
```bash
kubectl get namespaces
```
which will return output similar to:
```bash
NAME STATUS AGE
kube-system Active 20d
kube-public Active 20d
kube-node-lease Active 20d
default Active 20d
ingress Active 6d23h
container-registry Active 6d23h
operator-onprem Active 6d23h
element-onprem Active 6d23h
```
#### Show the status of the stateful sets in the `element-onprem` namespace
```bash
kubectl get sts -n element-onprem
```
This should return output similar to:
```bash
NAME READY AGE
postgres 1/1 6d23h
instance-synapse-main 1/1 6d23h
```
#### Show the Synapse configuration
Click to see commands for installers prior to version 2023-05.05
For installers prior to 2022-05.06, use:
```bash
kubectl describe cm -n element-onprem first-element-deployment-synapse-shared
```
For the 2022-05.06 installer and later, use:
```bash
kubectl -n element-onprem get secret synapse-secrets -o yaml 2>&1 | grep shared.yaml | awk -F 'shared.yaml: ' '{print $2}' - | base64 -d
```
For the 2023-05.05 installer and later, use:
```bash
kubectl --namespace element-onprem get \
secrets first-element-deployment-synapse-main \
--output jsonpath='{.data.instance_template\.yaml}' \
| base64 --decode
```
Note there are separate config secrets for writers. Use `kubectl --namespace element-onprem get secrets` to get a list, then modify the command as needed.
#### Verify DNS names and IPs in certificates
In the `certs` directory under the configuration directory, run:
```bash
for i in $(ls *crt); do echo $i && openssl x509 -in $i -noout -text | grep DNS; done
```
This will give you output similar to:
```bash
local.crt
DNS:local, IP Address:192.168.122.118, IP Address:127.0.0.1
synapse2.local.crt
DNS:synapse2.local, IP Address:192.168.122.118, IP Address:127.0.0.1
```
and this will allow you to verify that you have the right host names and IP addresses in your certificates.
#### View the MAU Settings in Synapse
```bash
kubectl get -n element-onprem secrets/synapse-secrets -o yaml | grep -i shared.yaml -m 1| awk -F ': ' '{print $2}' - | base64 -d
```
which will return output similar to:
```plaintext
# Local custom settings
mau_stats_only: true
limit_usage_by_mau: False
max_mau_value: 1000
mau_trial_days: 2
mau_appservice_trial_days:
chatterbox: 0
enable_registration_token_3pid_bypass: true
```
## Integration issues
### GitHub not sending events
You can trace webhook calls from your GitHub application under `Settings`/`developer settings`/`GitHub Apps`
Select your GitHub App
Click on `Advanced` and you should see queries issues by your app under `Recent Deliveries`
[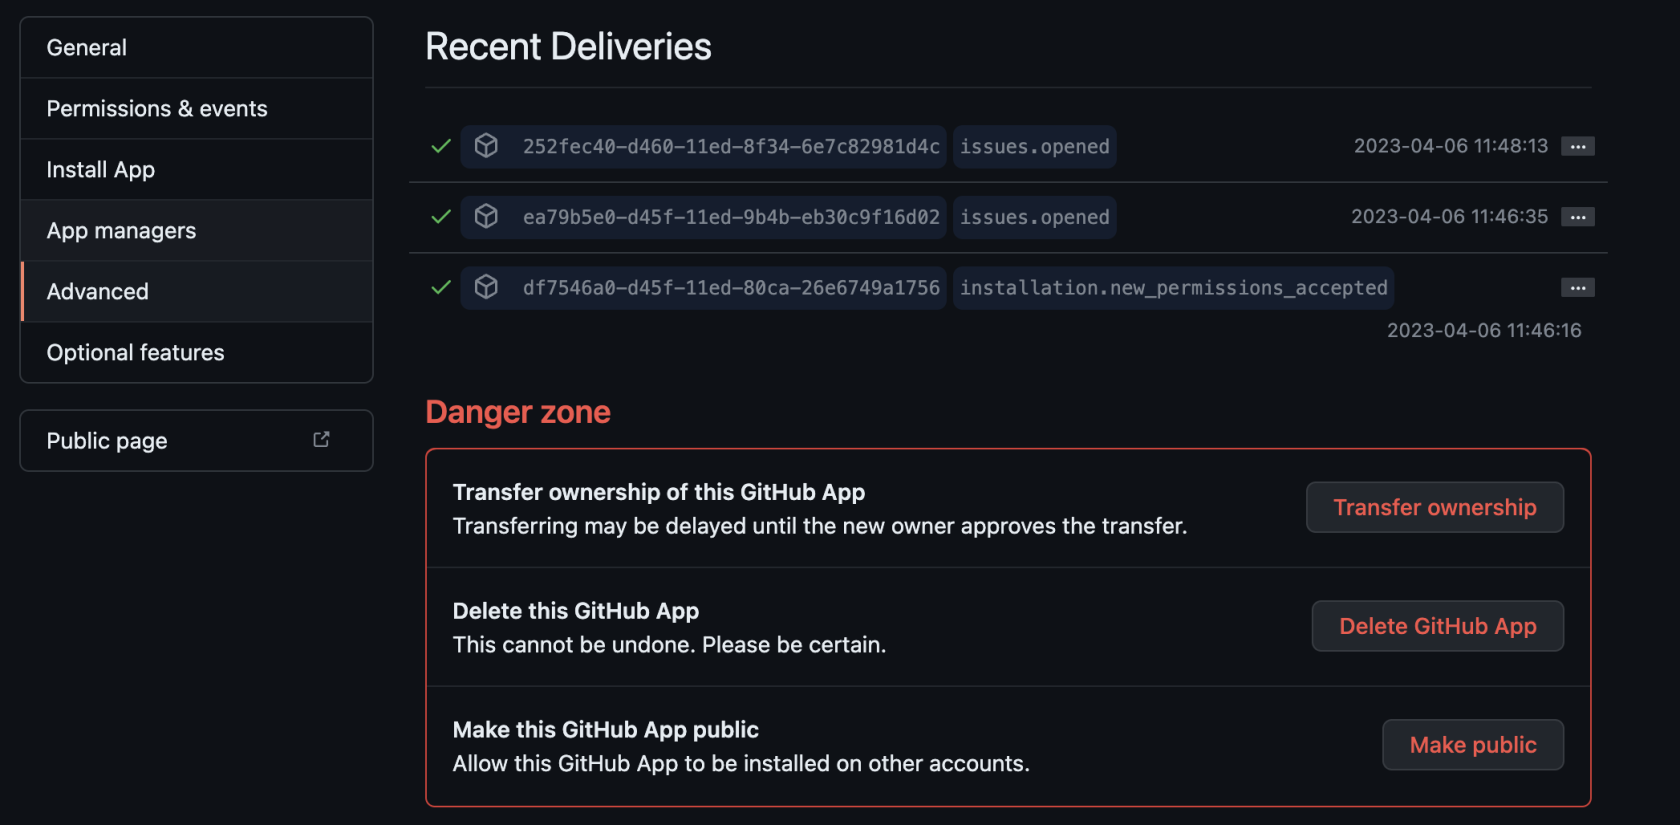](https://ems-docs.element.io/uploads/images/gallery/2023-04/SNLscreenshot-2023-04-06-at-12-12-42.png)
## Updater and Operator in `ImagePullBackOff` state
Check EMS Image Store Username and Token
Check to see if you can pull the Docker image:
`kubectl get pods -l app.kubernetes.io/instance=element-operator-controller-manager -n operator-onprem -o yaml | grep 'image:'`
grab the entry like `image: gitlab-registry.matrix.org/ems-image-store/standard/kubernetes-operator@sha256:305c7ae51e3b3bfbeff8abf2454b47f86d676fa573ec13b45f8fa567dc02fcd1`
Should look like
`microk8s.ctr image pull gitlab-registry.matrix.org/ems-image-store/standard/kubernetes-operator@sha256:305c7ae51e3b3bfbeff8abf2454b47f86d676fa573ec13b45f8fa567dc02fcd1 -u :`